| |
|
IO
~ Moon of Jupiter
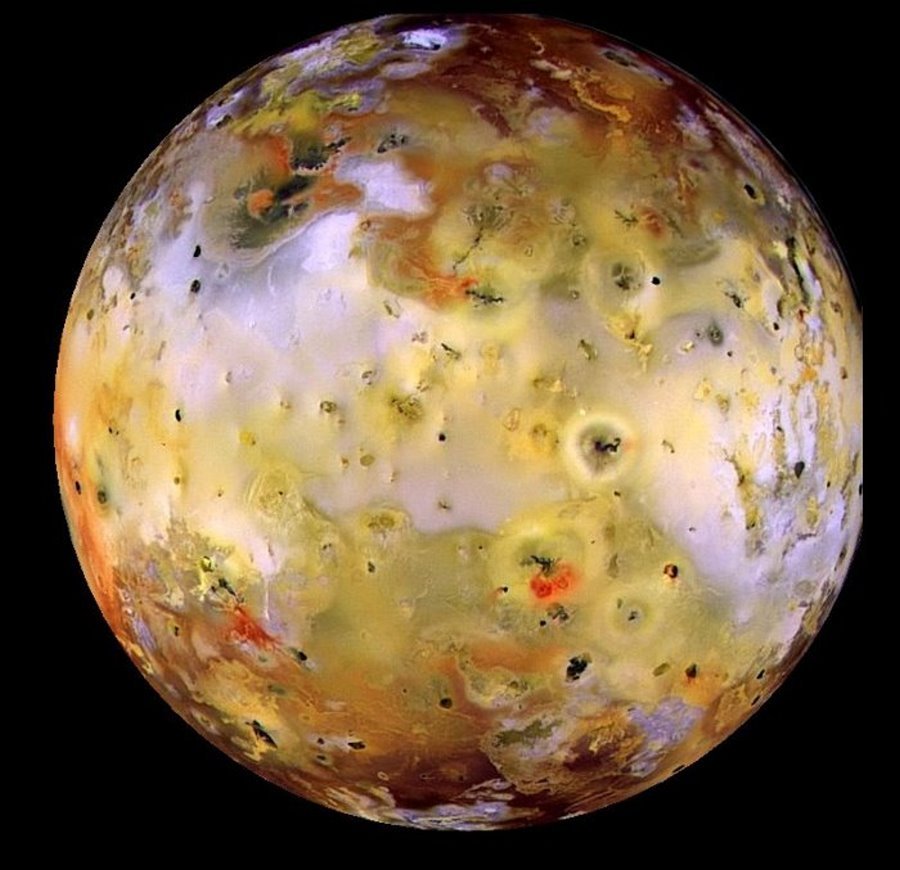 |
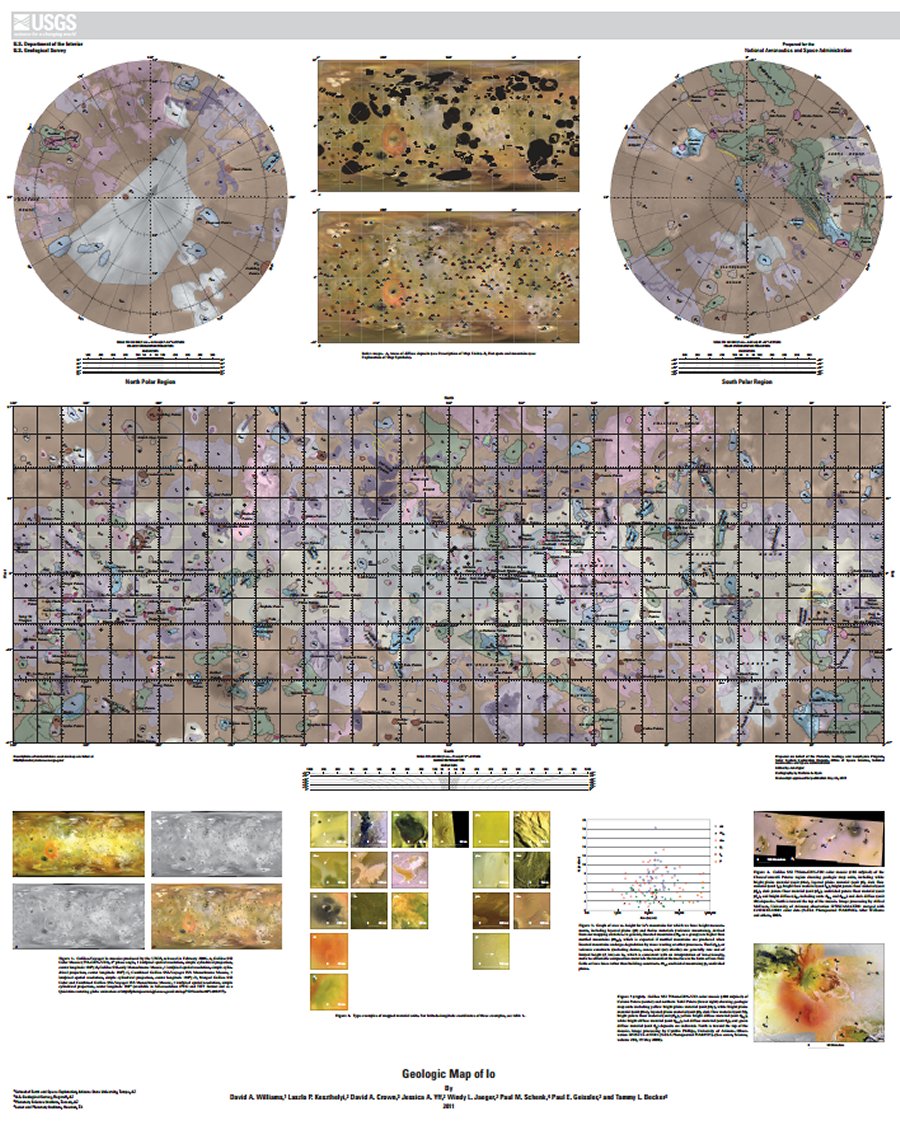
Io
Global Image Mosaic and Geologic Map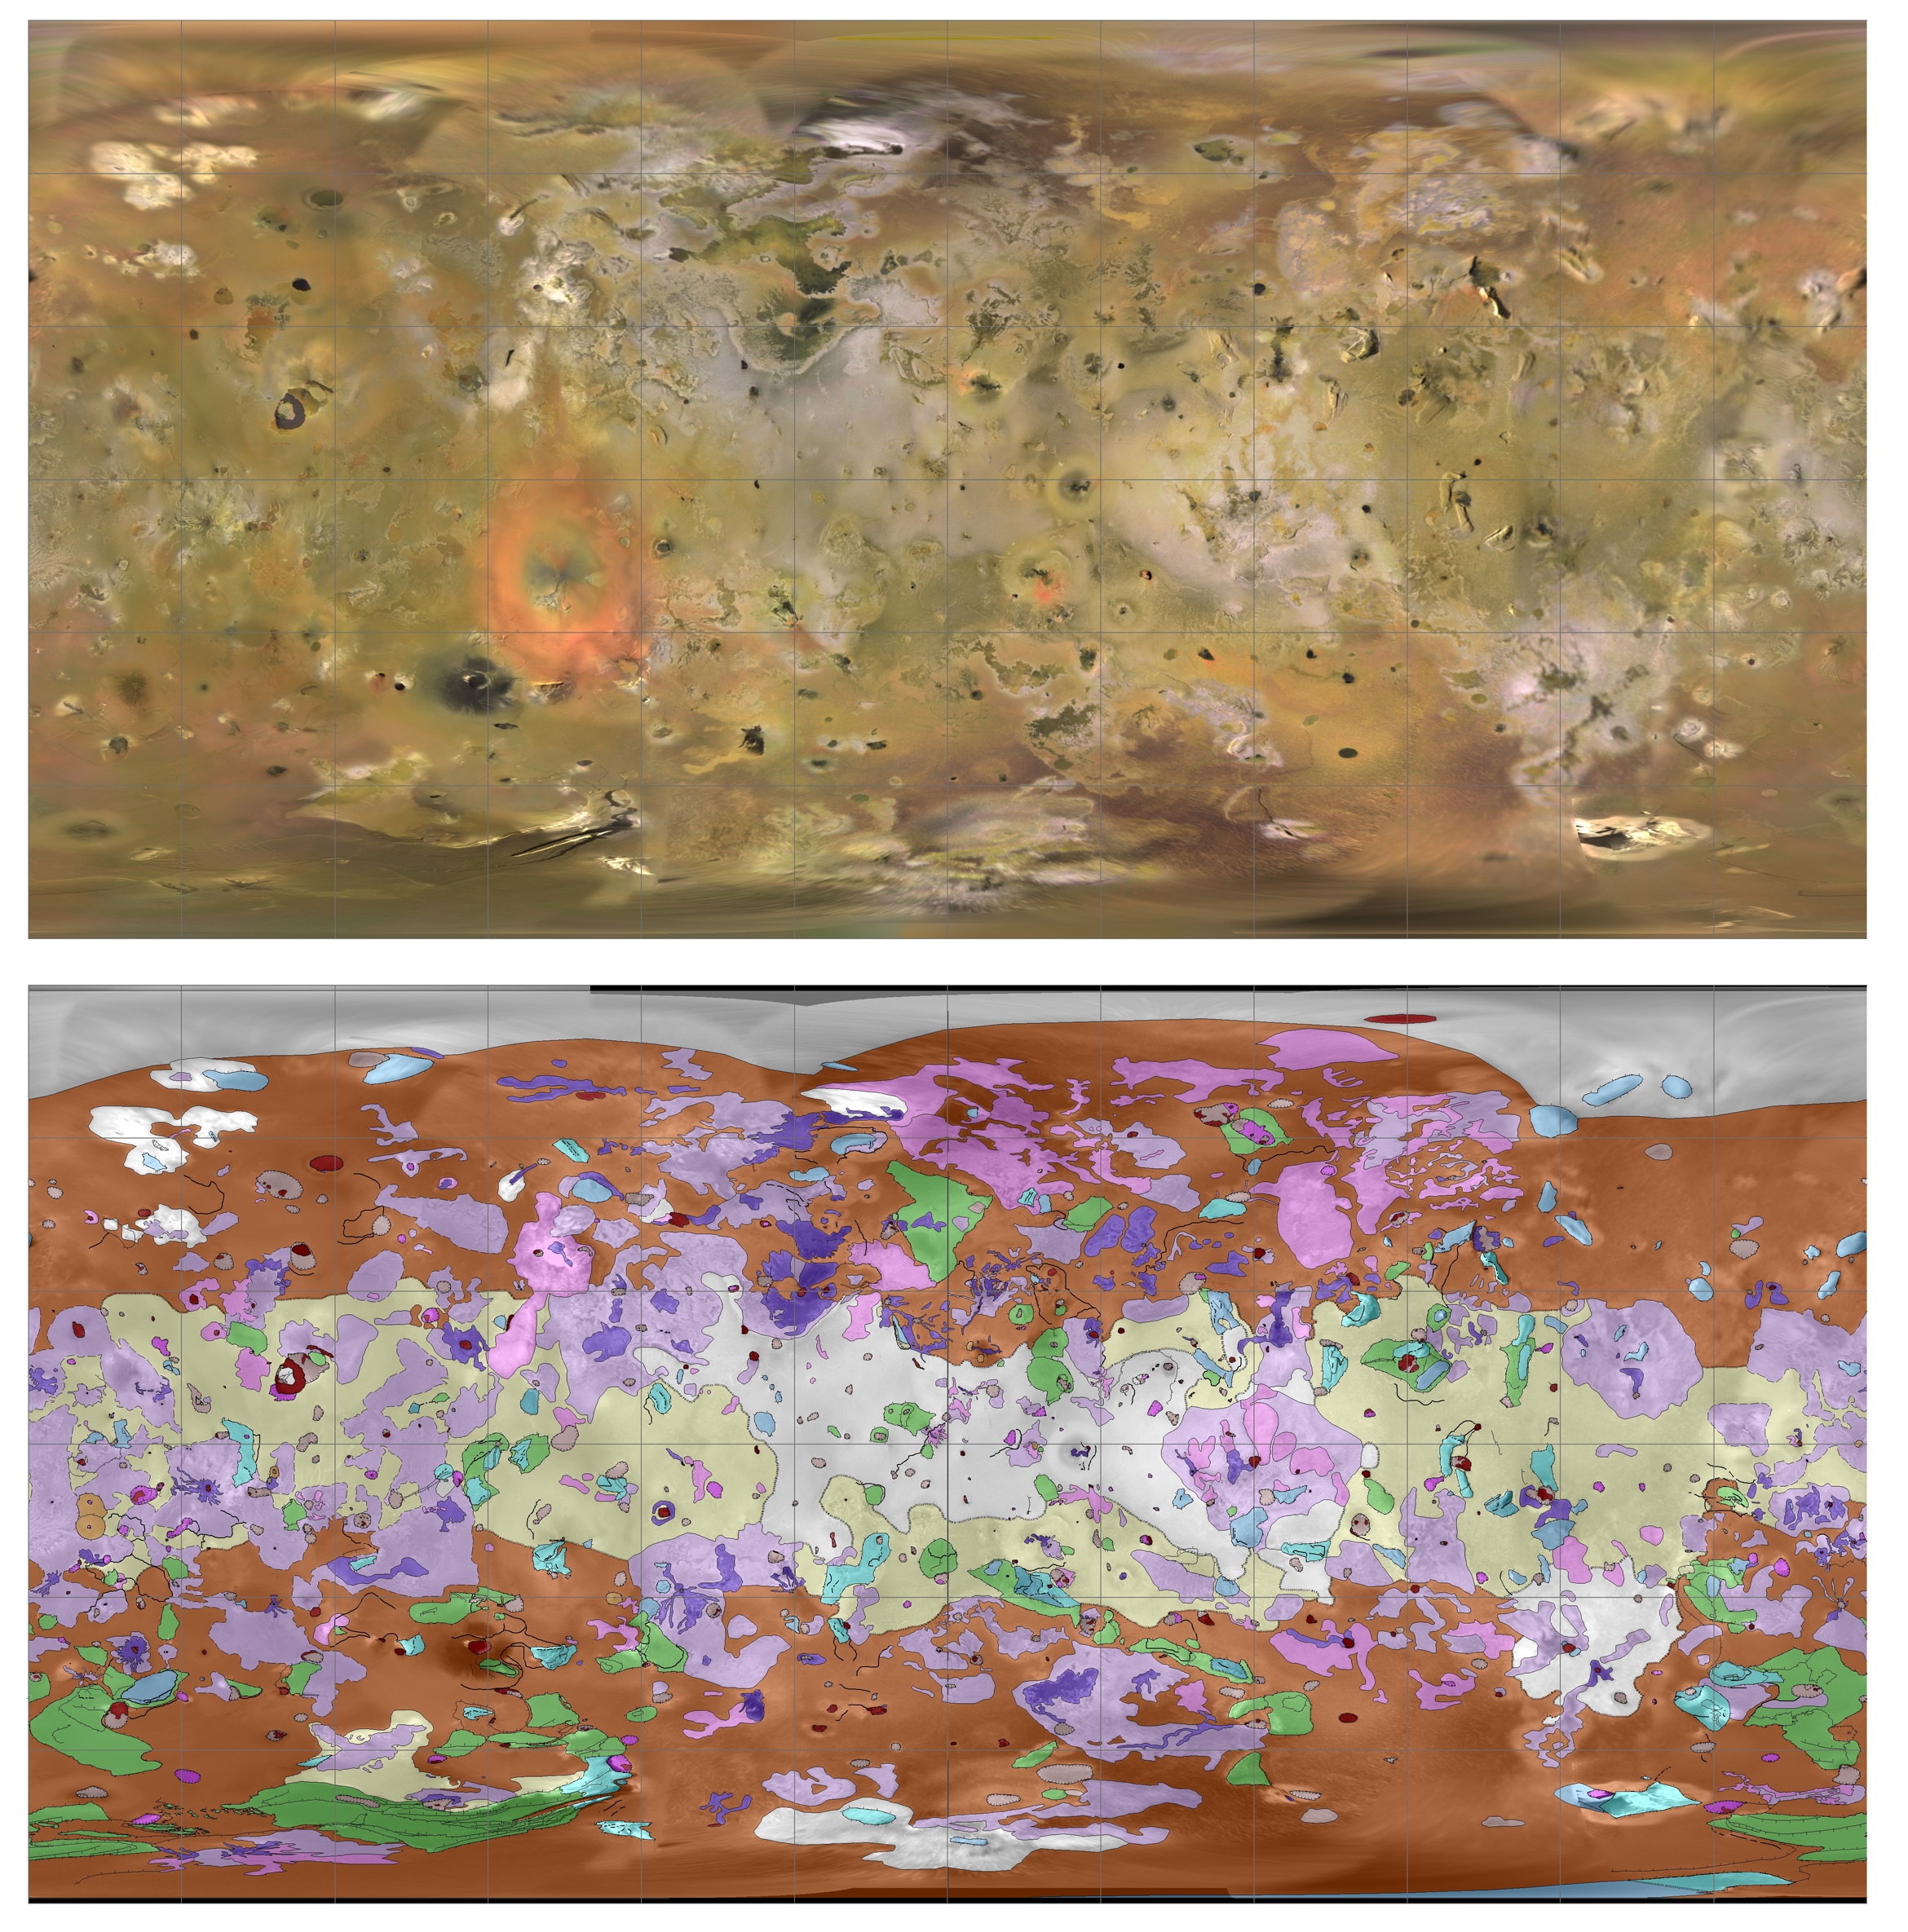 Image mosaics were produced by
USGS. Geologic map was authored by Dr. David
Williams (Arizona State University) and was published
by the USGS as scientific investigations map (SIM)
3168. The geologic map was published in 2012. The
global mosaic base was created in 2006 from spacecraft
images (Voyager, 1979 and Galileo, 1996-2001)
Credit:
U.S. Geological Survey
|
Geologic Map of IoBy David A.
Williams, Laszlo P. Keszthelyi, David A. Crown,
Jessica A. Yff, Windy L. Jaeger, Paul M. Schenk, Paul
E. Geissler, and Tammy L. Becker
|
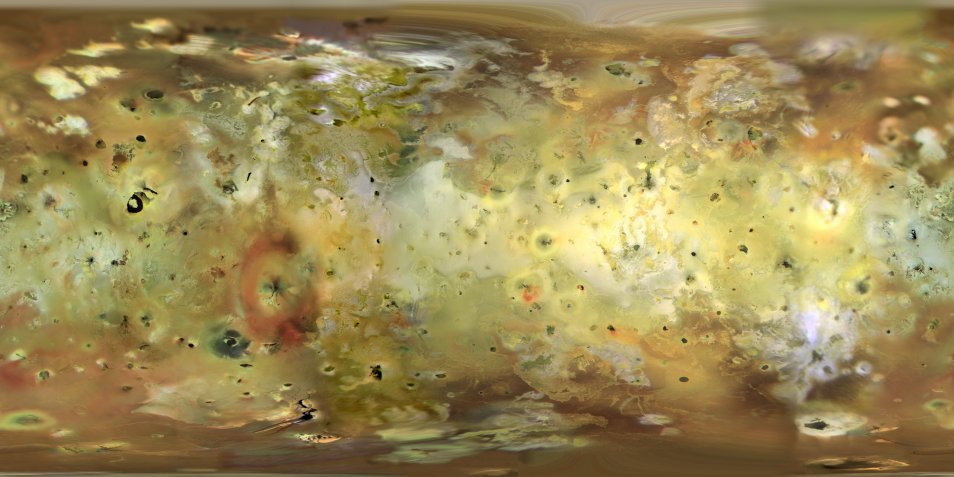 For the second image a near-hemispheric Galileo mosaic was used for about 40% of the map. This was reprojected from a vertical perspective projection (spacecraft view - similar to orthographic) onto the cylindrical lat/lon grid. For the third image a portion of this Galileo mosaic was reprojected to cover about 10% of the map. The color balance was adjusted and saturation was subdued to undo the "enhanced" color in the posted Galileo image. The fourth image comes from a portion of this Galileo mosaic, reprojected to cover the remaining 10% of the map. This fourth color image was augmented by higher resolution intensity information from a black and white USGS map. Seams were blended gradually between the various images to reduce their prominence. Some further color adjustments are being made to compensate for the extended wavelength range of the Galileo filters. ~ Steve Albers NOAA |
|
All material on these pages, unless otherwise noted, is © Pegasus Research Consortium 2001-2019 |
 Webpages © 2001-2019 Pegasus Research Consortium |